Destination Performance
Index 2023
Get a quick and comprehensive overview of your destination's satisfaction, loyalty, and promotion levels with just one glance.
About the DPI
Discover the Destination Performance Index (DPI) - a key metric within our World Travel Monitor® evaluates over 140 travel destinations in-depth and tracks their attractiveness over time.
We don't estimate our numbers from publicly available data on travel websites or social media platforms - we conduct population-representative interviews with tens of thousands of real people around the globe to provide accurate insights.
Our DPI metrics include DPI Satisfaction, DPI Loyalty, DPI Promotion, and DPI Overall for your destination, which is derived from travellers’ feedback on factors such as satisfaction, loyalty, and promotion using the scientifically proven key metric of the Net Promoter Score (NPS).
Additionally, our sociodemographic background and trip-specific information (such as type of holiday, price or modal split) allow you to analyse the data for specific segments within your target market. Stay ahead of the game with our reliable and comprehensive travel data.
Download our free Infographic and gain valuable insights:
- What is the source market with the most satisfied travellers?
- Which source markets have the lowest DPI values?
- What are the continental differences?
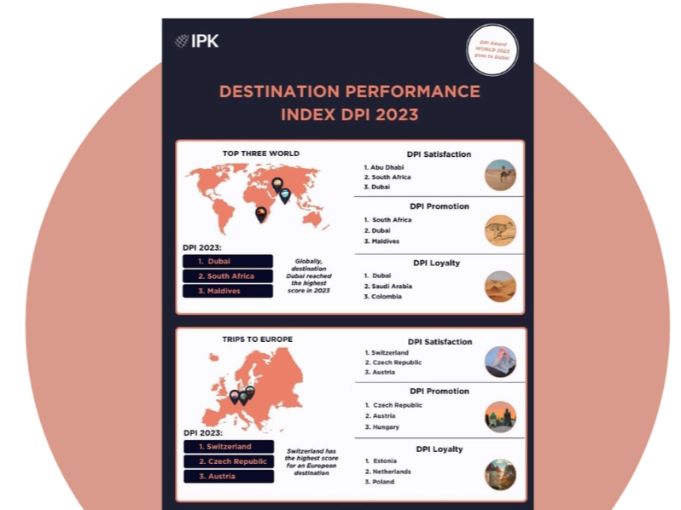
- Shifting to the inbound perspective, which destinations have the highest DPI scores globally?
Access the DPI download here:
Please note that the fields marked with (*) are mandatory.